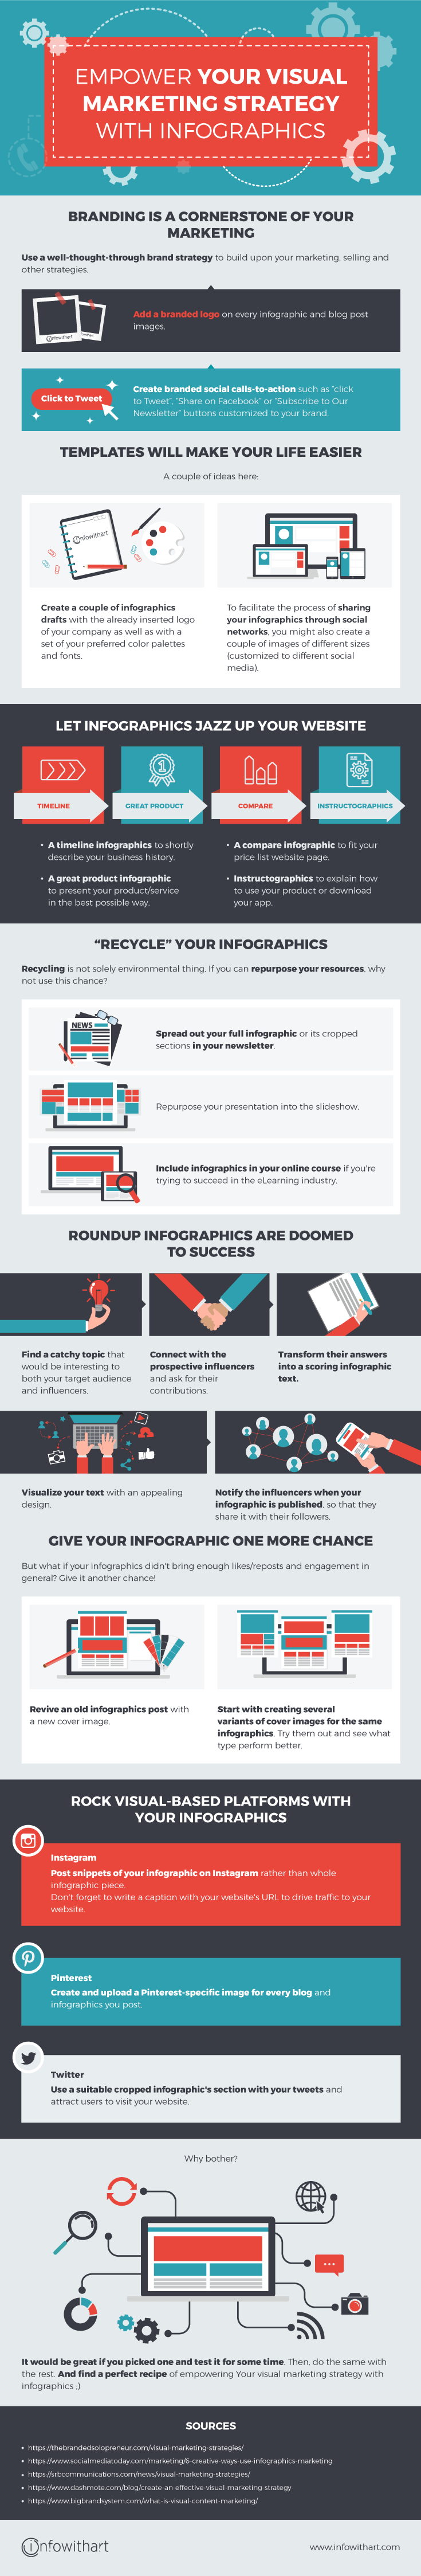
Empower Your Visual Marketing Strategy with Infographics
21th of February, 2019 | Infowithart
With our ”How to Create Infographics” series, you’ve learned some ways how to visualize your data effectively. Suppose, you have a great infographic piece. What’s next? Maybe it’s worth using it as a marketing tool on social media? Would you like to share it with your audience? If you’ve done the previous two, you’ll probably want to make it go viral as well.
Today we suggest moving forward. Have you already caught on to the visual content marketing hype? In both cases, why don’t you accord a permanent and uniquely special place to infographics in your visual marketing strategy? It means doing more than simply posting your infographics via your social networks on a regular basis or sharing them under your blog articles. Read on and find out about that “more”.
Branding is a Cornerstone of Your Marketing
Use a well-thought-through brand strategy to build upon your marketing, selling and other strategies. It’ll define the vision of your company’s future and set the framework for the current tactical moves. What does it have to do with your infographics?
• If you share infographics quite often, it’ll do a lot for your brand recognition.
• If your infographics are shared on different social platforms, it helps to keep visual consistency.
• A nice bonus to the abovementioned here is preventing your works from being stolen.
The bottom line:
Add a branded logo on every infographic. The same goes for the blog post images if your infographic complements one of your articles.
Create branded social calls-to-action such as “click to Tweet”, “Share on Facebook” or “Subscribe to Our Newsletter” buttons customized to your brand. That would add a fun touch to your visual consistency and is more likely to arouse interest to actually click.
Templates Will Make Your Life Easier
The best thing about this advice is that it’s a real time-saver. A nice bonus is that it helps you to stay consistent.
But we’re not inspiring you to create boring clones here. It’s rather about having ready those things that constantly reappear in all your infographics. Maybe, it would be a couple of infographics drafts with the already inserted logo of your company as well as with a set of your preferred color palettes and fonts. In order to facilitate the process of sharing your infographics through social networks, you might also create a couple of images of different sizes (customized to different social media).
Let Infographics Jazz Up Your Website
“It’s already in my ‘Blog’ section” you might say. But we’d say: “Go further!”
• So, for instance, a timeline infographics can shortly describe your business history and highlight the most crucial moments of your company.
• Similarly, a great product infographic or some of its elements in your ‘Products’ section can present your product or service in the best possible way.
• A compare infographic would perfectly fit the page with your price list.
• And instructographics are very helpful if you need to give a short and simple explanation/instruction (e.g. how to use your product or download your app etc.)
“Recycle” Your Infographics
Recycling is not solely environmental thing. If you can repurpose your resources, why not use this chance? Here’re a couple of possible directions for your infographics “recycling”:
Newsletter
Spread out your full infographic pieces in regular e-mails. They are more attention-catching than plain text. Thus, you have better chances to attract more clicks.
Or you may supplement your main message with the parts of your infographics. Just split your infographic into sections and use them as headers/footers for your newsletter.
Presentation
For instance, you can save yourself an evening before a product presentation to the new client if you already have a product infographic. All you have to do is to repurpose it into the slideshow. The cropped sections can easily become PowerPoint slides.
Online Course
Infographics can help you succeed in the eLearning industry. It’s not a big surprise since their purpose is to simplify complicated data. So, when creating and publishing your online course, consider inserting at least a couple of infographics to spice it up.
Roundup Infographics Are Doomed to Success
Just as roundup posts, roundup infographics are built with contributions from many influencers. This fact automatically makes them huge traffic attractors. Sounds interesting, doesn’t it?
• So, first of all, find a catchy topic that would be interesting to both your target audience and influencers. By the way, the latter ones can be found on different outreach platforms.
• Connect with the prospective influencers and ask for their contributions.
• The next step is to transform their answers into a scoring infographic text. By the way, here are some tips on how to prevent your content from being boring.
• Visualize your text with an appealing design.
• And don’t forget to notify the influencers when your infographic is published. They will help you promote it by sharing it with their followers.
Give Your Infographic One More Chance
A typical infographics lifecycle looks as follows. First of all, you post an infographic along with the article on your blog. Then you share the link to it on your networks. The top level is when you crop an interesting part of your infographic to use it as a cover image while posting on different social platforms. But what if all of that didn’t bring enough likes/reposts and engagement in general?
Give it another chance!
• Revive an old infographics post with a new cover image! Amazingly enough, a new pin, tweet or facebook post can get much more traffic to the old content.
• Start with creating several variants of cover images for the same infographics. Try them out and see what type perform better. One can attract a particular audience, the other type will work best for other users. Eventually, you’ll be able to find your own style.
Rock Visual-based Platforms with Your Infographics
Instagram
Post snippets of your infographic on Instagram. It’s far more effective than just sharing the whole infographic piece. It would be even better if you identified your infographic’s sections to promote them individually, and shared them on different time throughout the day.
You may also combine business with pleasure. While gathering likes and attracting more followers, don’t forget to write a caption with your website’s URL. Of course, if you want to attract traffic to your website.
Pinterest
Speaking of driving traffic, Pinterest is a priceless tool here. Create and upload a Pinterest-specific image for every blog and infographics you post. Thus, it becomes more likely to capture more attention on this platform.
Twitter
Again, it’s all about driving traffic in this section. Use a suitable cropped infographic’s section with your tweets and attract users to visit your website. Why bother? Simply because tweets with images receive 150% more clicks than the ones without.
We don’t expect you to try all these hacks right away. But it would be great if you picked one and test it for some time. Then, do the same with the rest. And find a perfect recipe of empowering Your visual marketing strategy with infographics 😉
SOURCES
thebrandedsolopreneur.com/visual-marketing-strategies
socialmediatoday.com/marketing/6-creative-ways-use-infographics-marketing
srbcommunications.com/news/visual-marketing-strategies
dashmote.com/blog/create-an-effective-visual-marketing-strategy
bigbrandsystem.com/what-is-visual-content-marketing