How To Create Infographics
17th March, 2018 | Infowithart
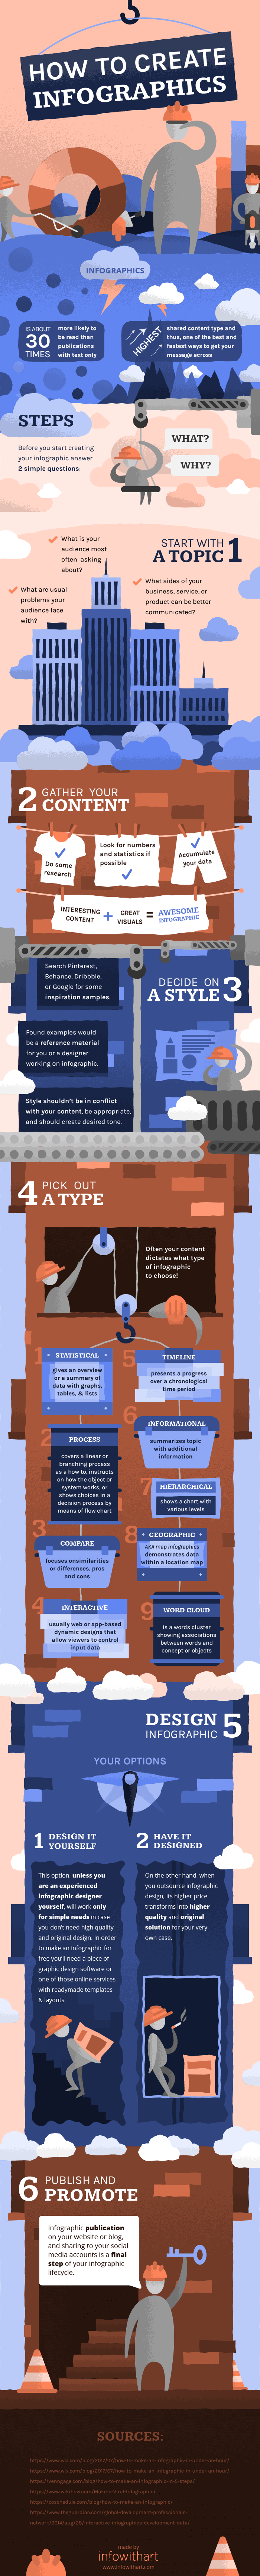
It is proved that infographics are about 30 times more likely to be read than text-only publications. Moreover, infographics have the highest shared content type. Thus, they are one of the best and fastest ways to get your message across to your target audience. So, how to create infographics?
Steps
First of all, please answer two simple questions: ‘What?’ and ‘Why?’ Do you know exactly what the goal of your next amazing infographic design is? Are you aware of why it’s important? Then, congratulations! You are ready to go. Also, you might want to check certain situations when to use infographics.
Let’s get back on track with specific steps on how to build an infographic:
1. Start with a topic
If you don’t have one yet, the following questions might give some hints:
• What is your audience asking about?
• Can you list the usual problems your audience faces?
• Are there any sides of your business, service, or product that can be better communicated?
2. Gather your content
Do some research. Accumulate data. Look for numbers and statistics if possible. Discover a story or invent one to deliver your message. In a word, write a smart copy. Mind that an interesting content paired with great visuals will allow you to produce a great infographic design.
3. Decide on the style
Search Pinterest, Behance, Dribbble, or Google for some inspiration. Found examples would serve as a reference material for you or designer(s) working on your infographic. Keep in mind that the style shouldn’t be in conflict with your content. It better not be outdated. Similarly, it should have appropriate tone (depends on your needs: more serious and corporate, or casual and fun).
4. Choose infographic type
Frankly speaking, most of the time the type of data, the content itself dictates what type of infographic to choose. Here is a brief infographic types walkthrough:
• Statistical Infographics – gives an overview or a summary of data with graphs, tables, and lists.
• Timeline Infographics – presents a progress over a chronological time period.
• Process Infographics – covers a linear or branching process as a how-to, instructs on how the object or system works, or shows choices in a decision process by means of a flowchart.
• Informational Infographics – summarizes topic with some additional information.
• Geographic Infographics – AKA map infographic – demonstrates data within a location map.
• Compare Infographics – focuses on similarities or differences, pros and.
• Hierarchical Infographics – shows a chart with levels.
• Interactive Infographics – usually web or app-based dynamic designs that allow viewers to control input data.
• Word cloud Infographics – is a cluster of words that show associations between words and concept or objects.
5. Design your infographic
Well, here you have just two options. You can either design it yourself or have it designed for you.
The first option, unless you are an experienced infographic designer yourself, will work only for simple needs in case you don’t need high quality and original design. In order to make an infographic for free, you’ll need a piece of graphic design software or one of those online services with premade templates and layouts.
On the other hand, when you outsource your infographic design, higher price transforms into higher quality and original custom solution for your very own case.
6. Publish and promote
Publication of your awesome infographic on your website, blog, and sharing to your social media accounts is the final logical step in infographic creation lifecycle. To wrap things up you might check on how to share infographics effectively
Sources
wikihow.com/Make-a-Viral-Infographic
wix.com/blog/2017/07/how-to-make-an-infographic-in-under-an-hour
theguardian.com/global-development-professionals-network/2014/aug/28/interactive-infographics-development-data