Make Your Infographics Content Scoring, Not Boring
26th of December, 2018 | Infowithart
One of our previous blog posts touched upon the topic “How to Create Infographics”. Basically, it was a step-by-step guide for the novices. Now, we’re going to present you with the series of articles to cover each step in more details. Today we will talk about content – the first pillar of infographics.
“Visual Content” Is Still Content in Its Essence
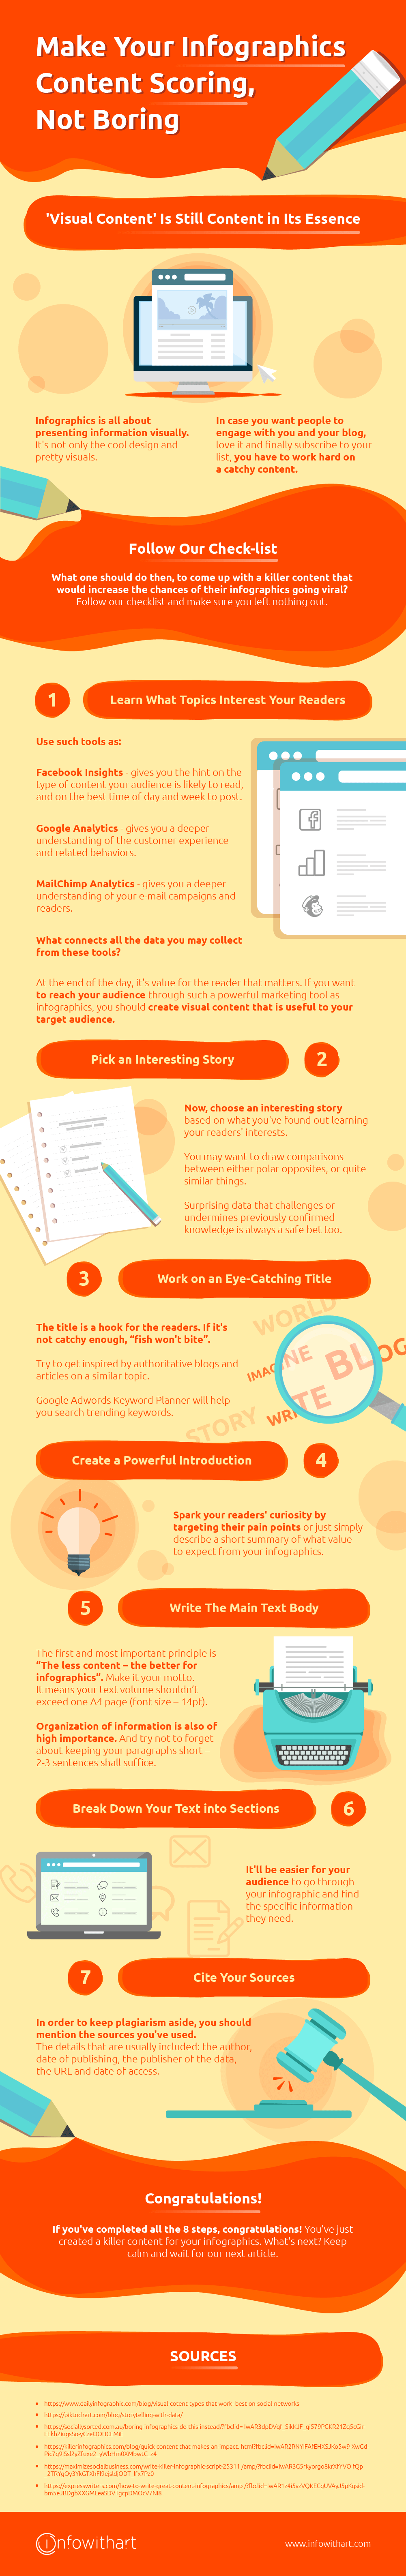
Infographics is all about presenting information visually. Nevertheless, if an infographic piece is limited only to the cool design and pretty visuals, it will not attract a lot of audience. In case you want people to engage with you and your blog, find and read more content on your site, love it and finally subscribe to your list, you have to work hard on a catchy content.
What one should do then, to come up with a killer content that would increase the chances of their infographics going viral? Follow our checklist and make sure you left nothing out.
1. Learn What Topics Interest Your Readers.
For this purpose, you may use such tools as Facebook Insights, Google and Mailchimp Analytics. The first one gives you the hint on the type of content your audience is likely to read, and on the best time of day and week to post. Google analytics tool gives you a deeper understanding of the customer experience and related behaviours, Mailchimp – of your e-mail campaigns and readers.
So, what connects all the data you may collect from these tools? At the end of the day, it’s value for the reader that matters. You might have a small business, own a huge multinational corporation or write a blog. Actually, it’s not that important. If you want to reach your audience through such a powerful marketing tool as infographics, you should create visual content that is useful to your target audience. Then your infographics will get shared and drive traffic back to your business.
2. Pick an Interesting Story.
Now, you have to tell your readers an interesting story. As it should advantageously stand out against the backdrop of thousands of boring articles in the field. Identifying trends will help you with this task as they point out a general direction in which something is changing or developing. You may want to draw comparisons between either polar opposites, or quite similar things. Surprising data that challenges or undermines previously confirmed knowledge is always a safe bet too.
3. Work on an Eye-Catching Title.
The title is a hook for the readers. If it’s not catchy enough, “fish won’t bite”.Try to get inspired by authoritative blogs and articles on a similar topic. And Google Adwords Keyword Planner will help you search trending keywords.
4. Create a Powerful Introduction.
Spark your readers’ curiosity by targeting their pain points or just simply describe a short summary of what value to expect from your infographics.
5. Write The Main Text Body.
Here comes the challenge. Infographic scripts differ from regular blog posts. The first and most important principle is “The less content – the better for infographics”. Actually, this remake of the classical quote “Brevity is the sister of talent” should be the motto of all infographics content writers. So, let’s talk numbers… It means your text volume shouldn’t exceed one A4 page (font size – 14pt).
Organization of information is also of high importance. Therefore, you need to experiment with different formatting styles. For instance, headings, bulleted or numbered lists. And try not to forget about keeping your paragraphs short – 2-3 sentences shall suffice.
6. Break Down Your Text into Sections.
It’ll be easier for your audience to go through your infographic and find the specific information they need.
7. Cite Your Sources.
In order to keep plagiarism aside, you should mention the sources you’ve used. The details that are usually included: the author, date of publishing, the publisher of the data, the URL and date of access.
If you’ve completed all the 8 steps, congratulations! You’ve just created a killer content for your infographics. What’s next? Keep calm and wait for our next article.
SOURCES
dailyinfographic.com/blog/visual-content-types-that-work-best-on-social-networks
piktochart.com/blog/storytelling-with-data
sociallysorted.com.au/boring-infographics-do-this-instead
killerinfographics.com/blog/quick-content-that-makes-an-impact.html
https://maximizesocialbusiness.com/write-killer-infographic-script-25311/?fbclid=IwAR3G5rkyorgo8krXfYVONfQp_2TRYgOy3YkGTXhFl9ejsldjODT_lfx7Pz0
expresswriters.com/how-to-write-great-content-infographics