Marathon Statistics Infographic
Design a sports infographic on the comprehensive marathon study. The main purpose here is to apply data visualization principles in order to present a wealth of statistical data in a simple, clear, and easy-to-digest way.
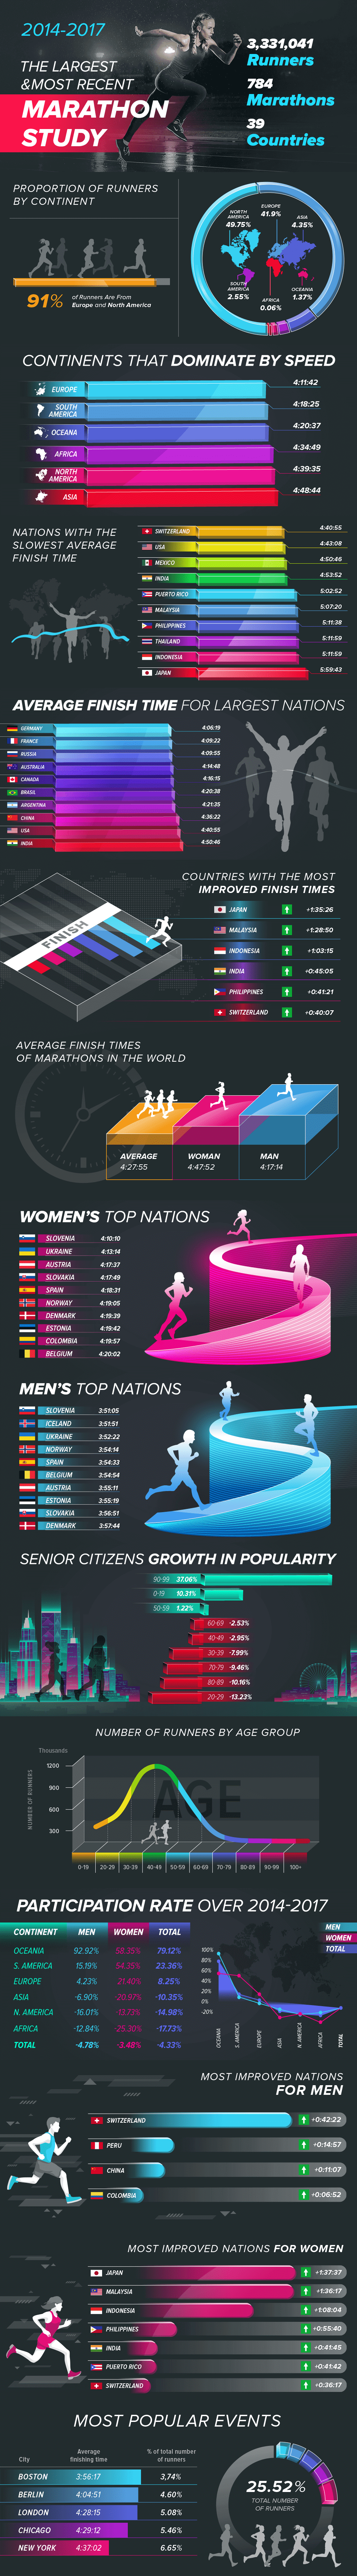
Since the content, in this case, includes many statistics, we decided to create a mixed charts infographic. Various charts, graphics, and histograms are stylized to have a visual impact on a reader and make the infographic piece demonstrative. A dark background perfectly contrasts with the bright, luminous colors of illustrations and fonts. Isometric graphics create the illusion of depth. Thus, our team managed not only to present a lot of numerical data but also to make the whole infographic piece highly appealing due to the modern design solution.
Category- Marketing Visuals
- Infographic
- Characters / Scenes
- Statistical
- Sports & Health
- Isometric