Isometric Infographics for Proventeq


Customer goal
The solution
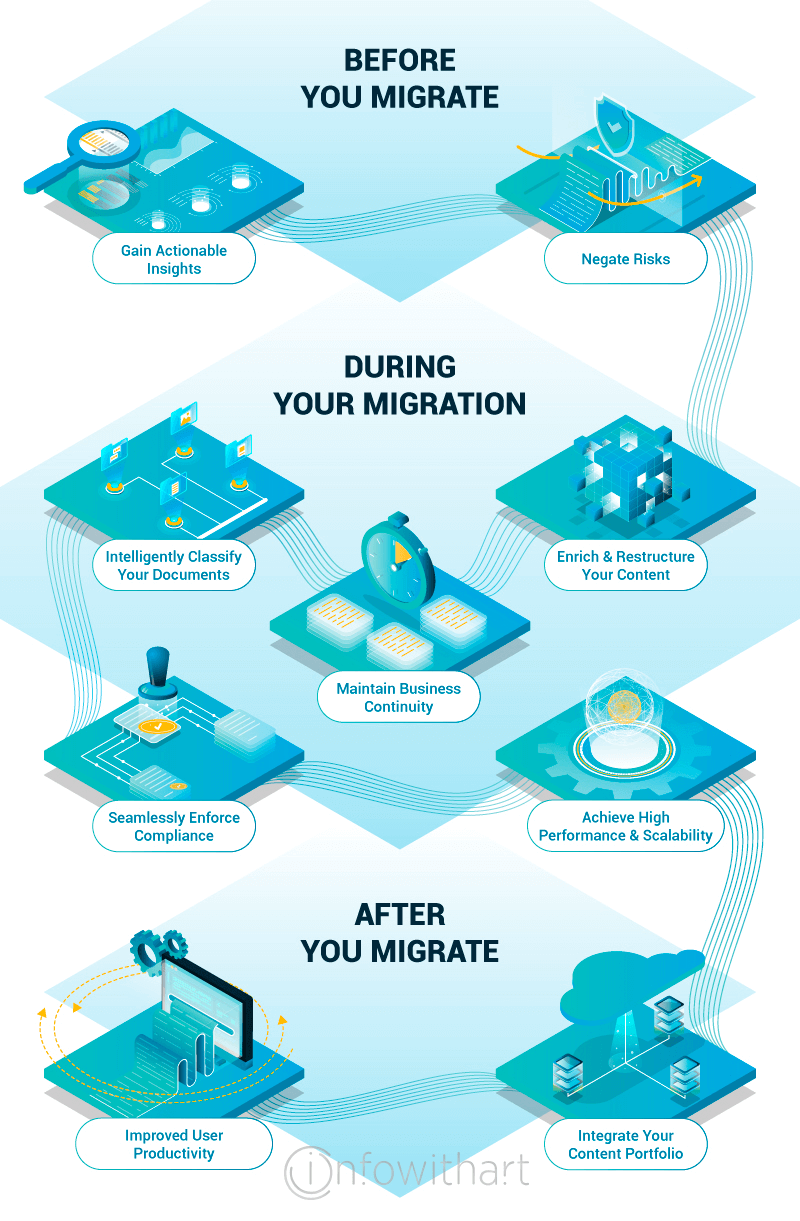
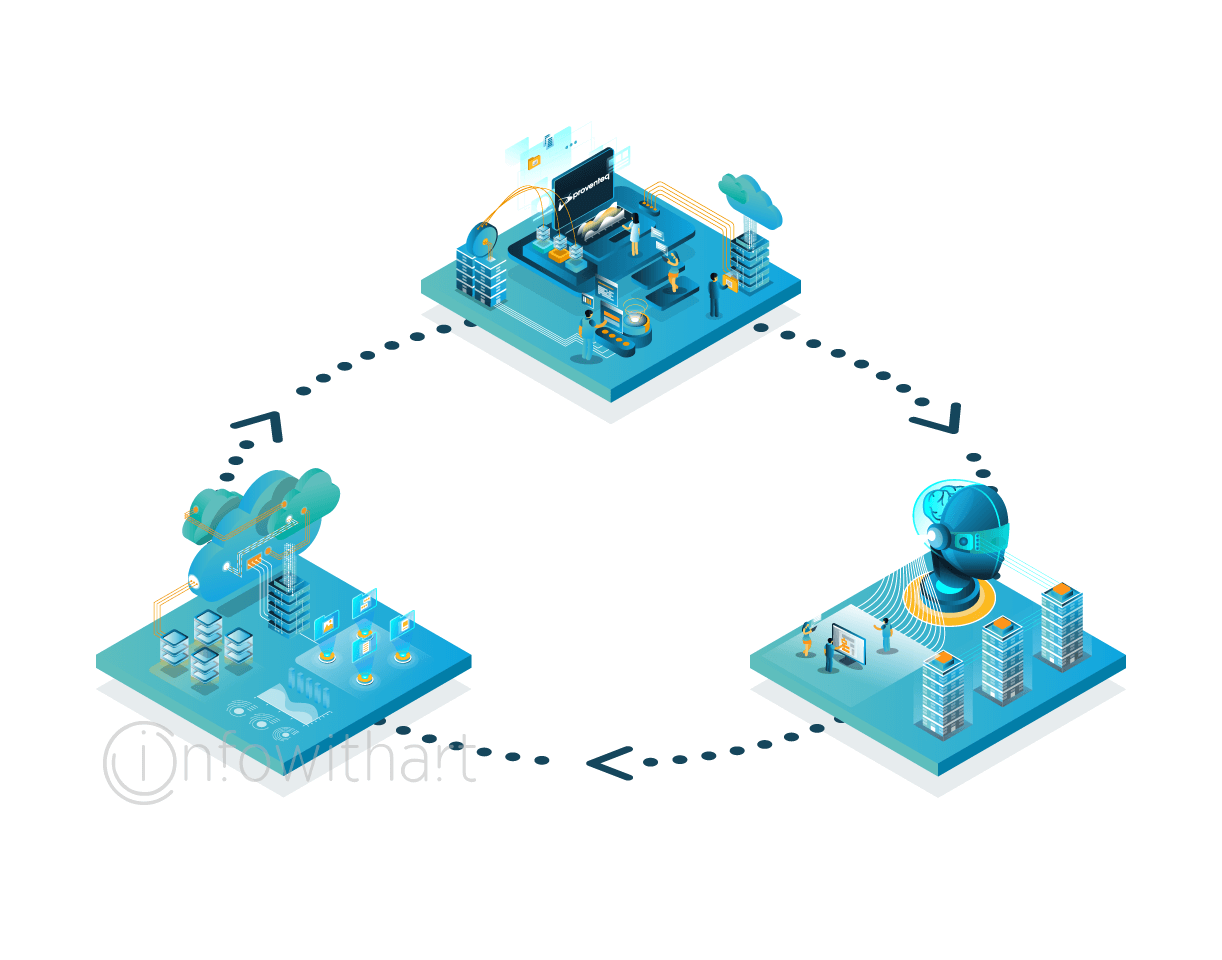
Devise a process infographic accompanied with the isometric illustrations which would describe in details the steps of data migration by using isometric style. The major purpose of these graphics is to walk the user through 3 main stages of the migration process, so that no important step is left out.
Building this infographic our designers have settled on 3D graphics visualisation of all the stages. The sequence of actions is demonstrated through the wires that consistently lead the reader from one stage to another. A combination of two major typefaces and a pleasant-for-eye colour scheme make the infographic piece easy to read and comprehend.
Category- Infographics
- Flowcharts
- Process
- Business & Consulting
- Data Analytics
- SaaS
- Technology
- Isometric


