Isometric illustrations for Rubyx
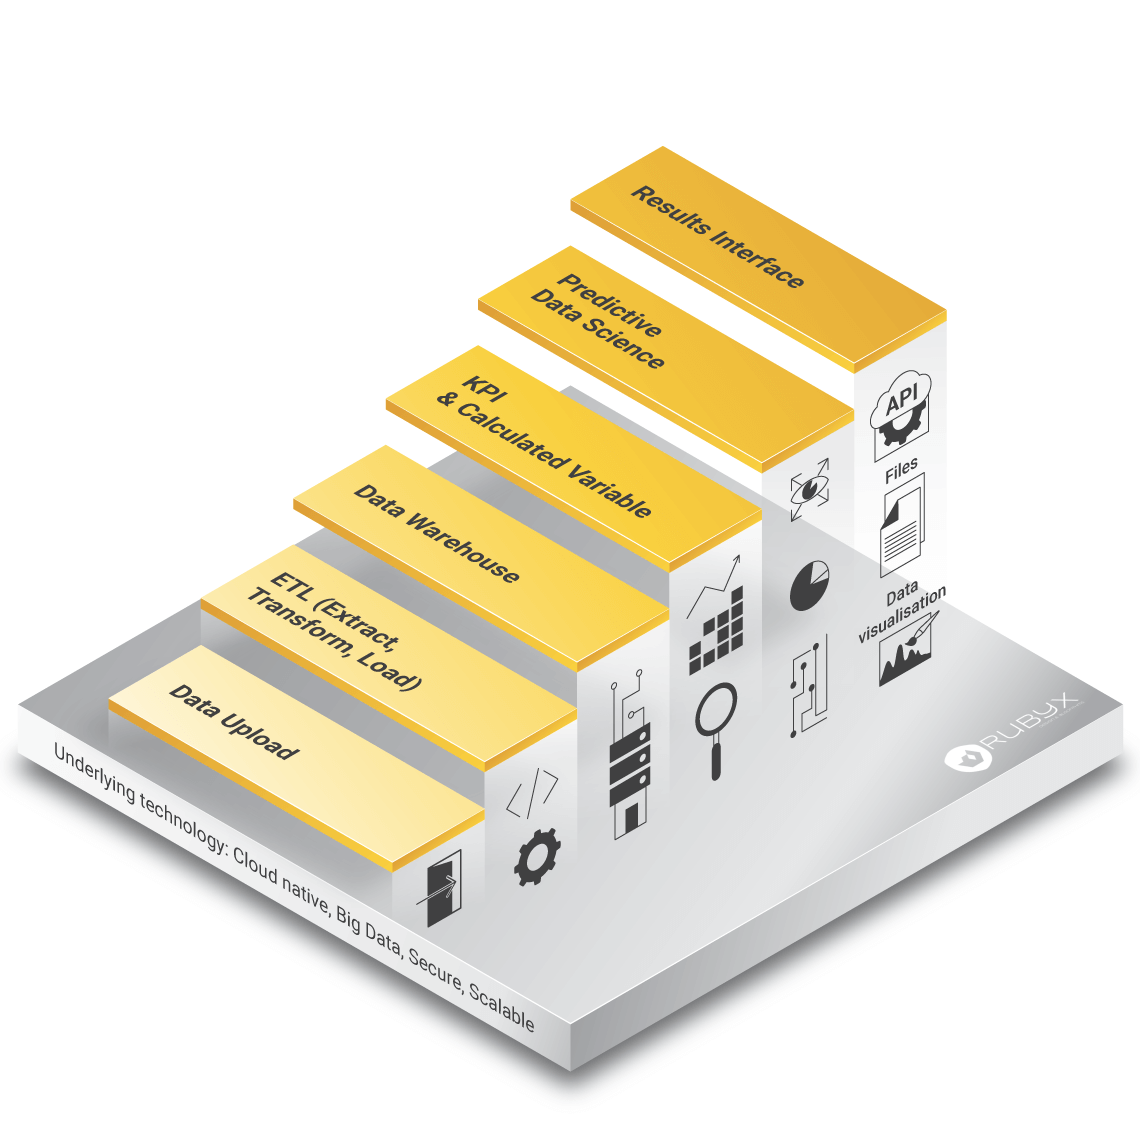
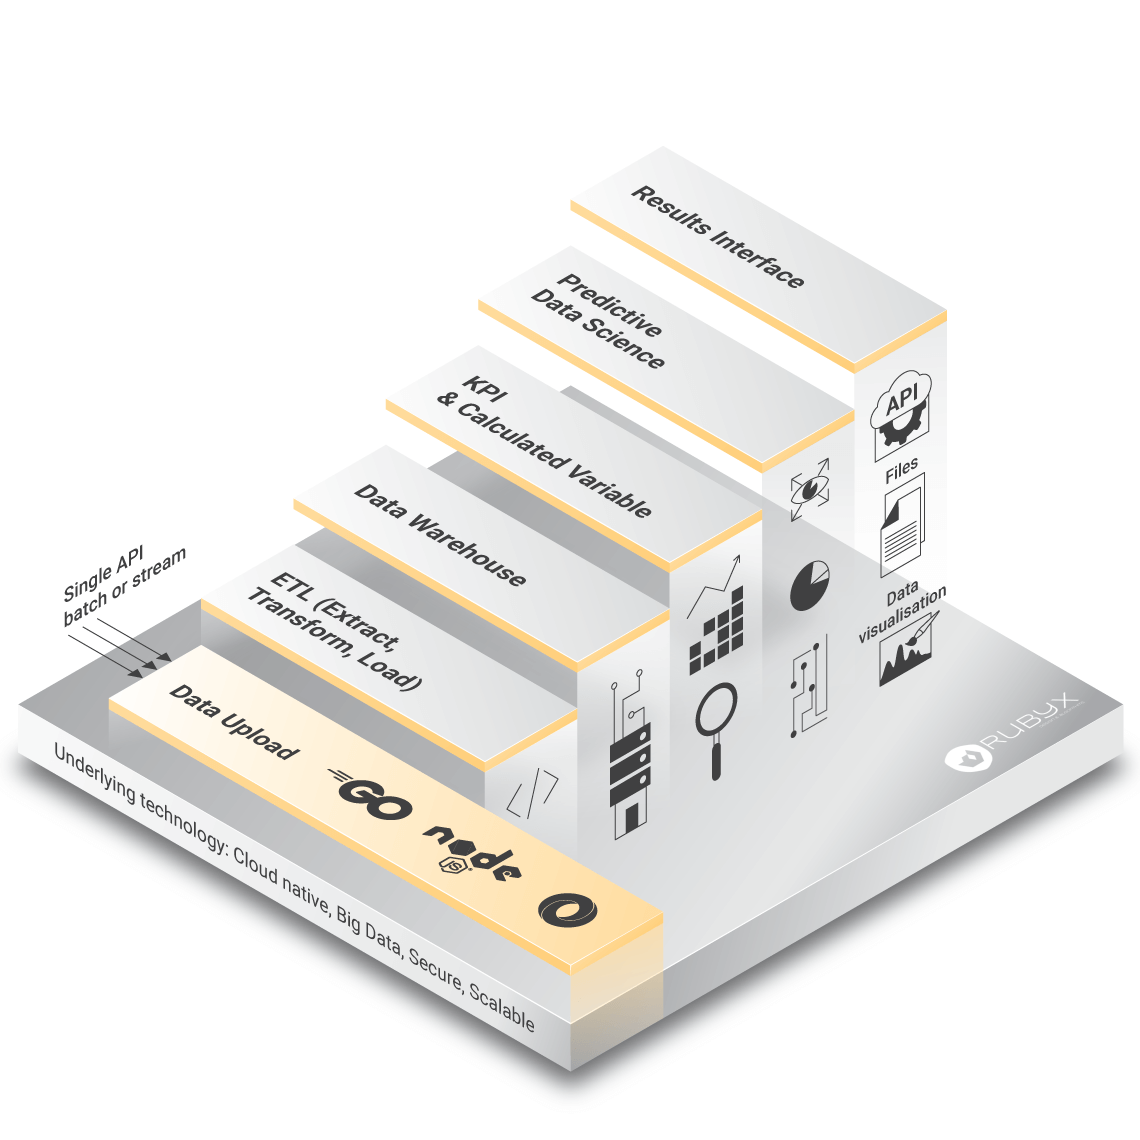
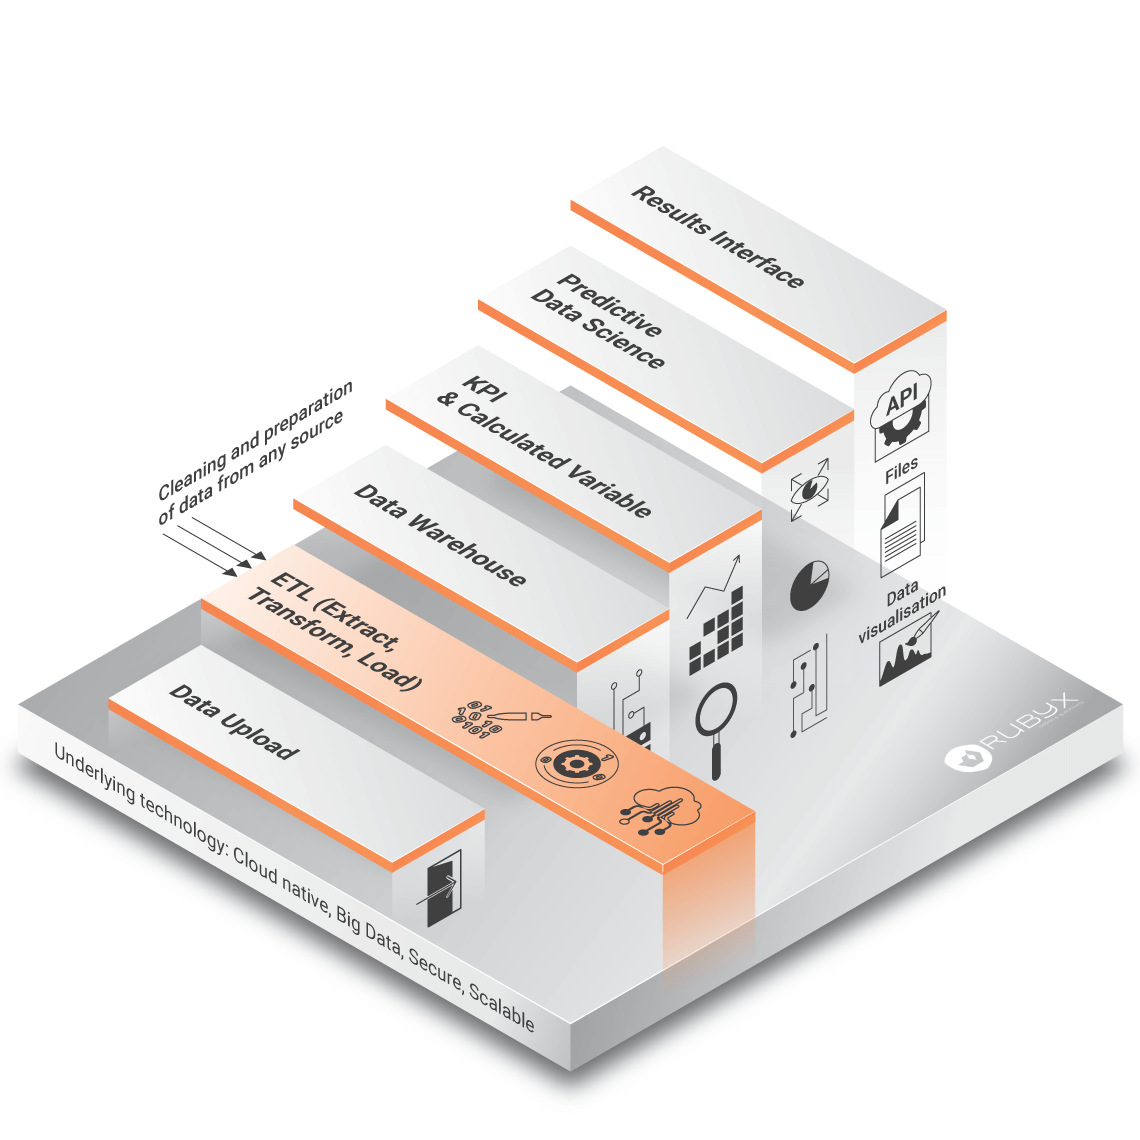
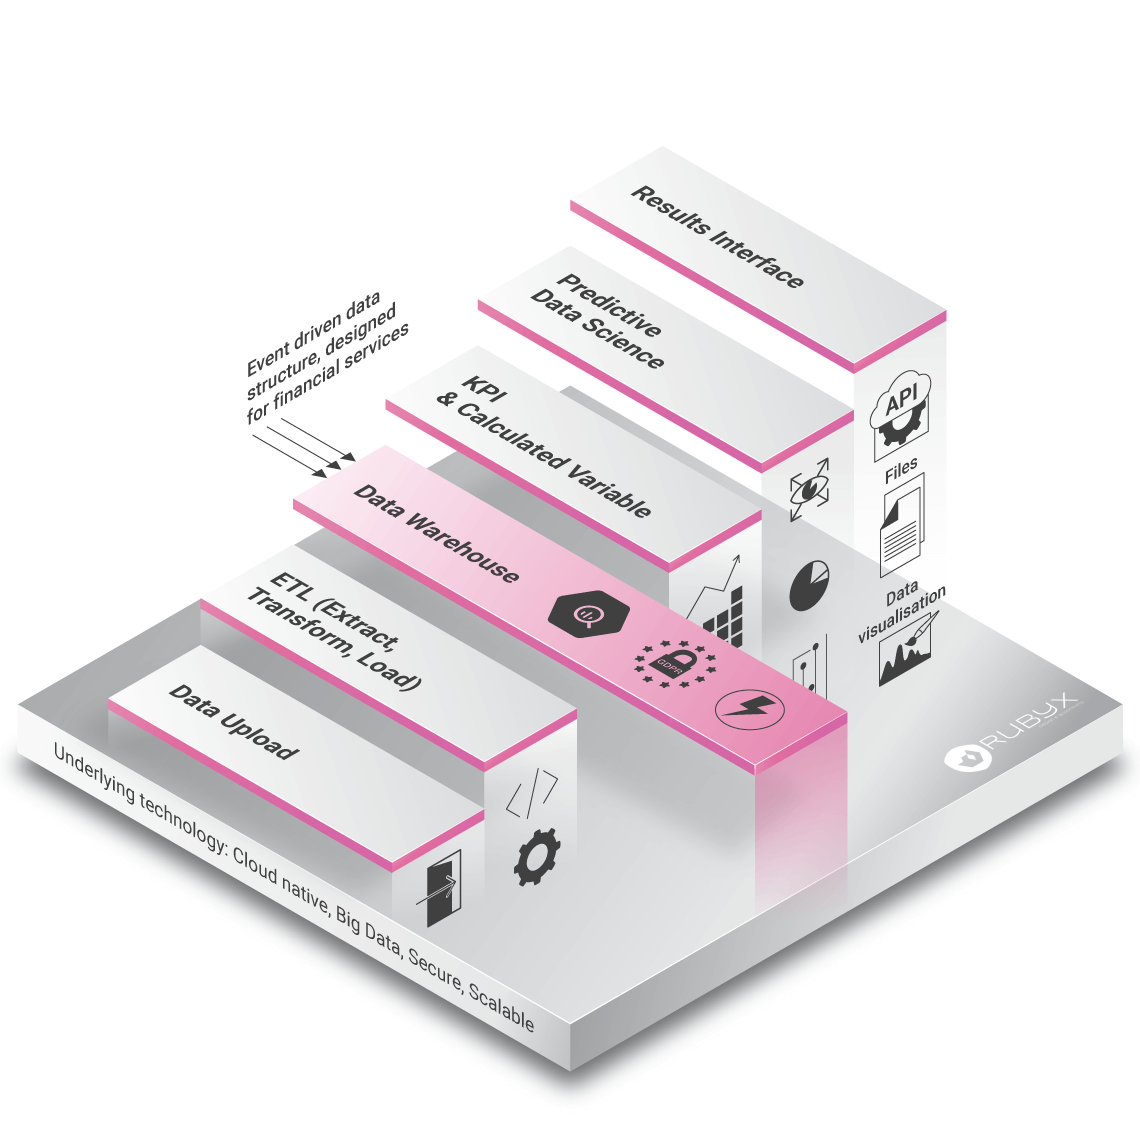
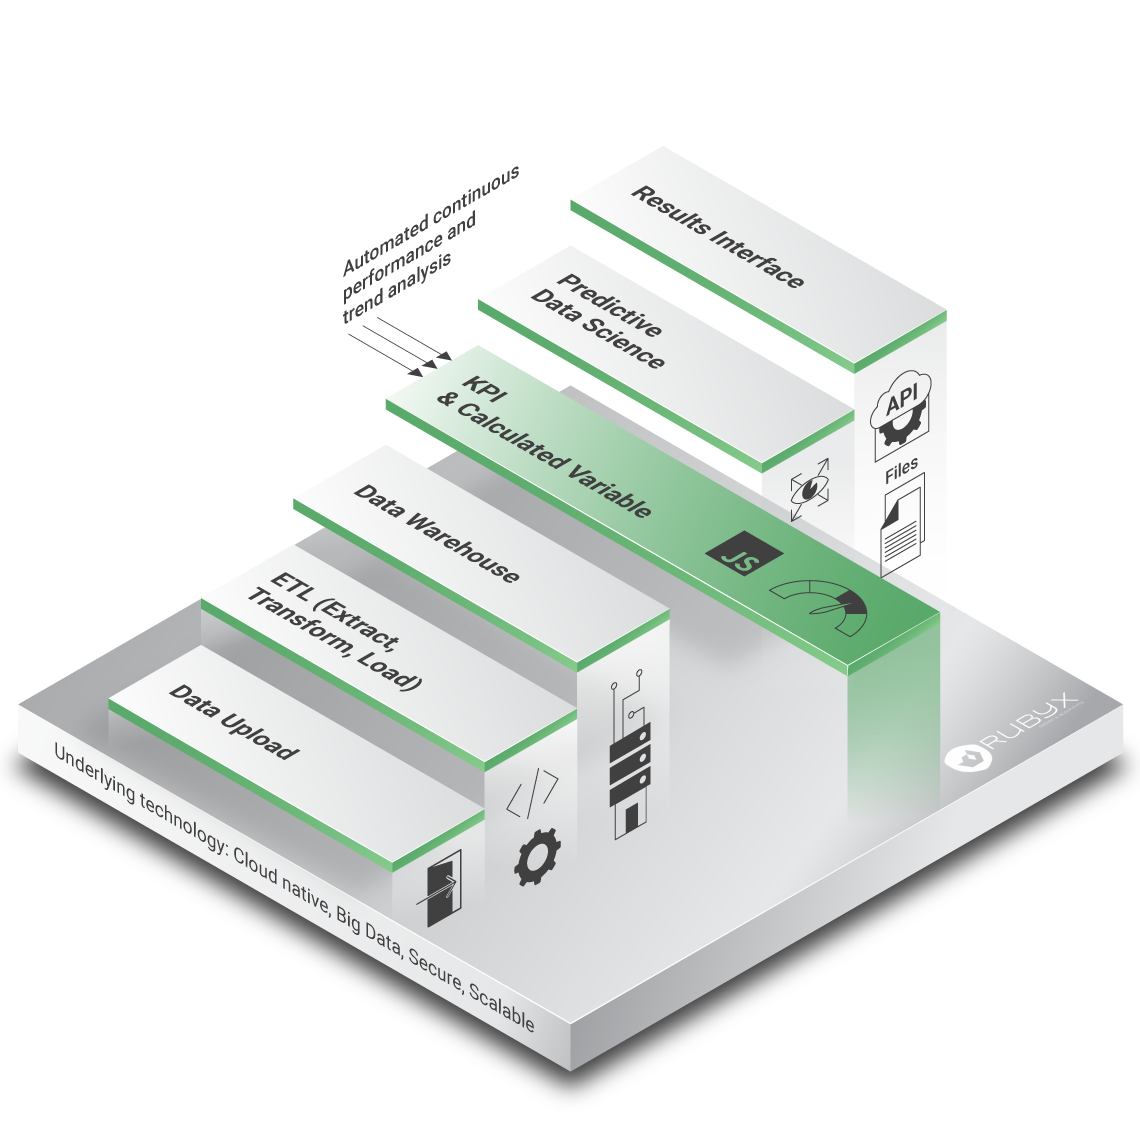
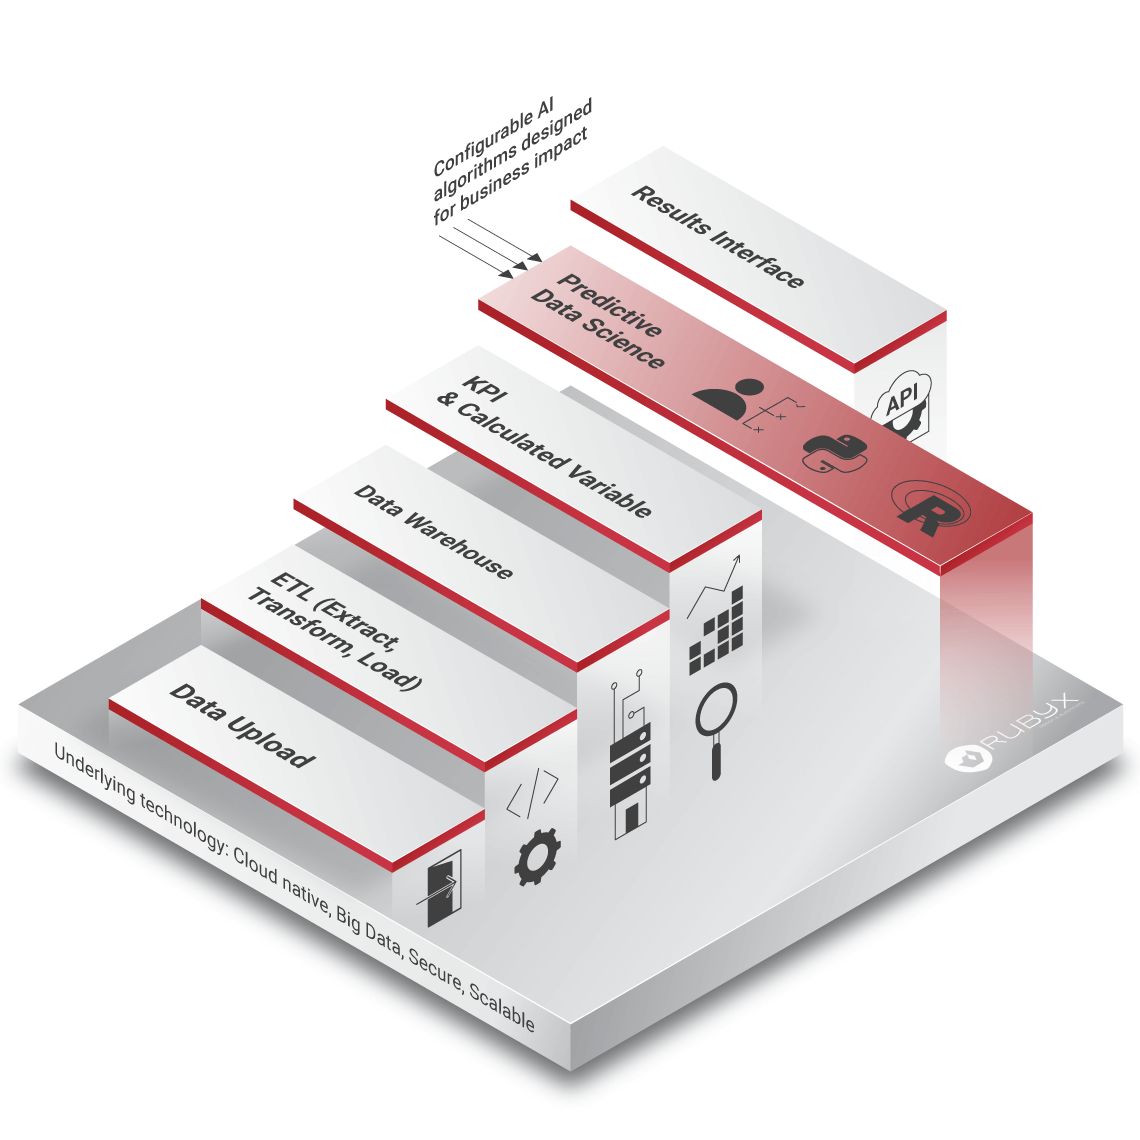
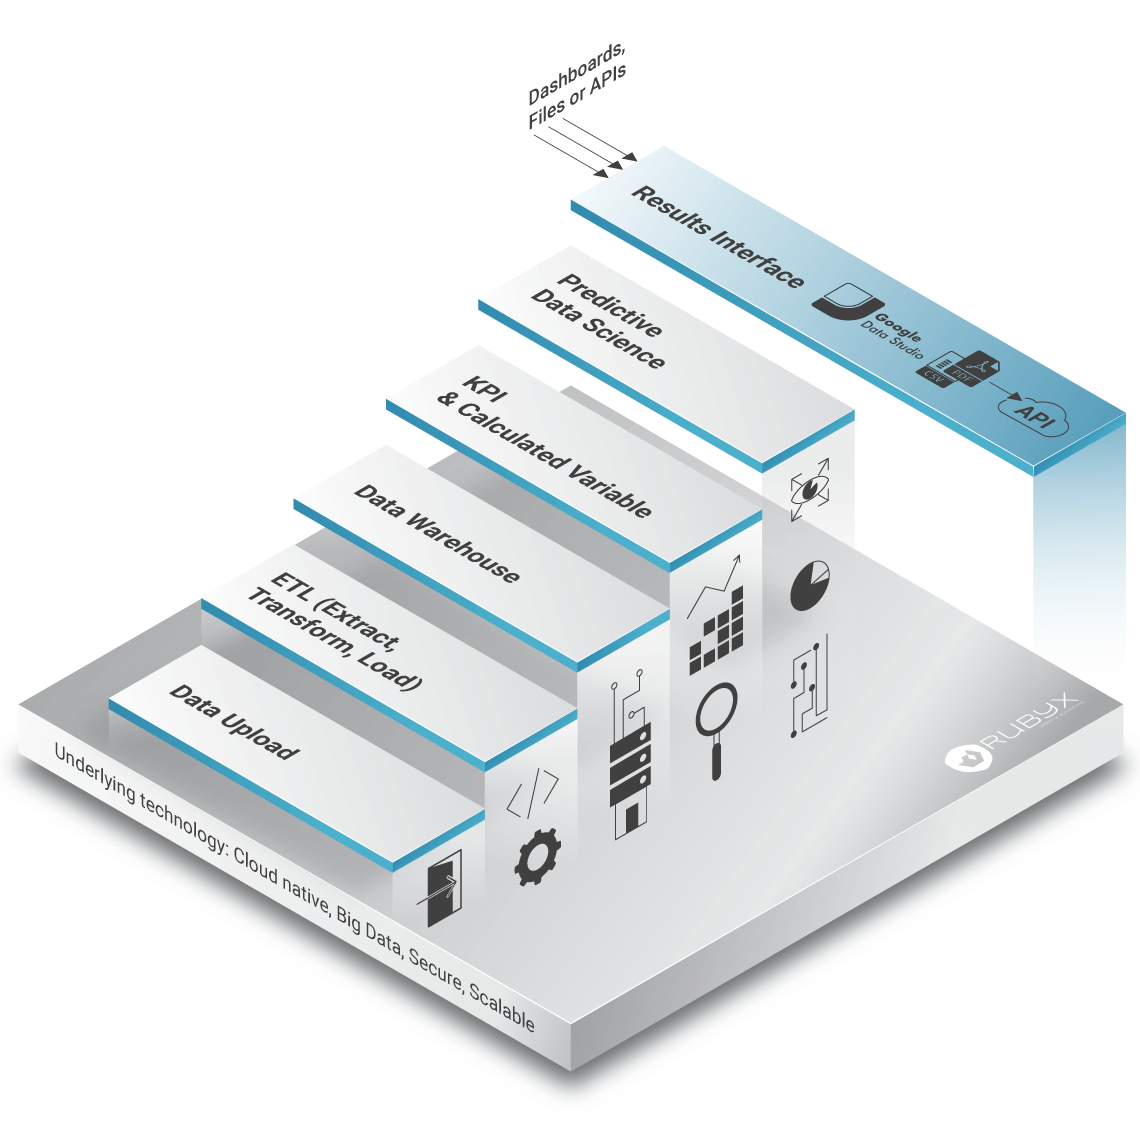
Create a series of isometric infographics for the client’s website. The key goal of this project is to demonstrate the product development and data science services provided by our client in an informative and appealing way.
The client’s decision-making platform for financial institutions was presented in the form of isometric stairs where each step represented the specific component of the platform. Neutral silver used for the basement and bright colors for the stairs create a great contrast. Minimalist black icons serve as captions under the steps and give short info about each stage.
To make the website as user-friendly as possible, every isometric illustration is complemented with a separate lineart icon in the description of the main section, so that the user can easily skip some stages, if necessary, and get to the needed step right upon clicking.
Category- Illustrations
- Objects
- Data Analytics
- Technology
- Isometric
- Outline


