Infographics for ITD
Customer goal
The solution
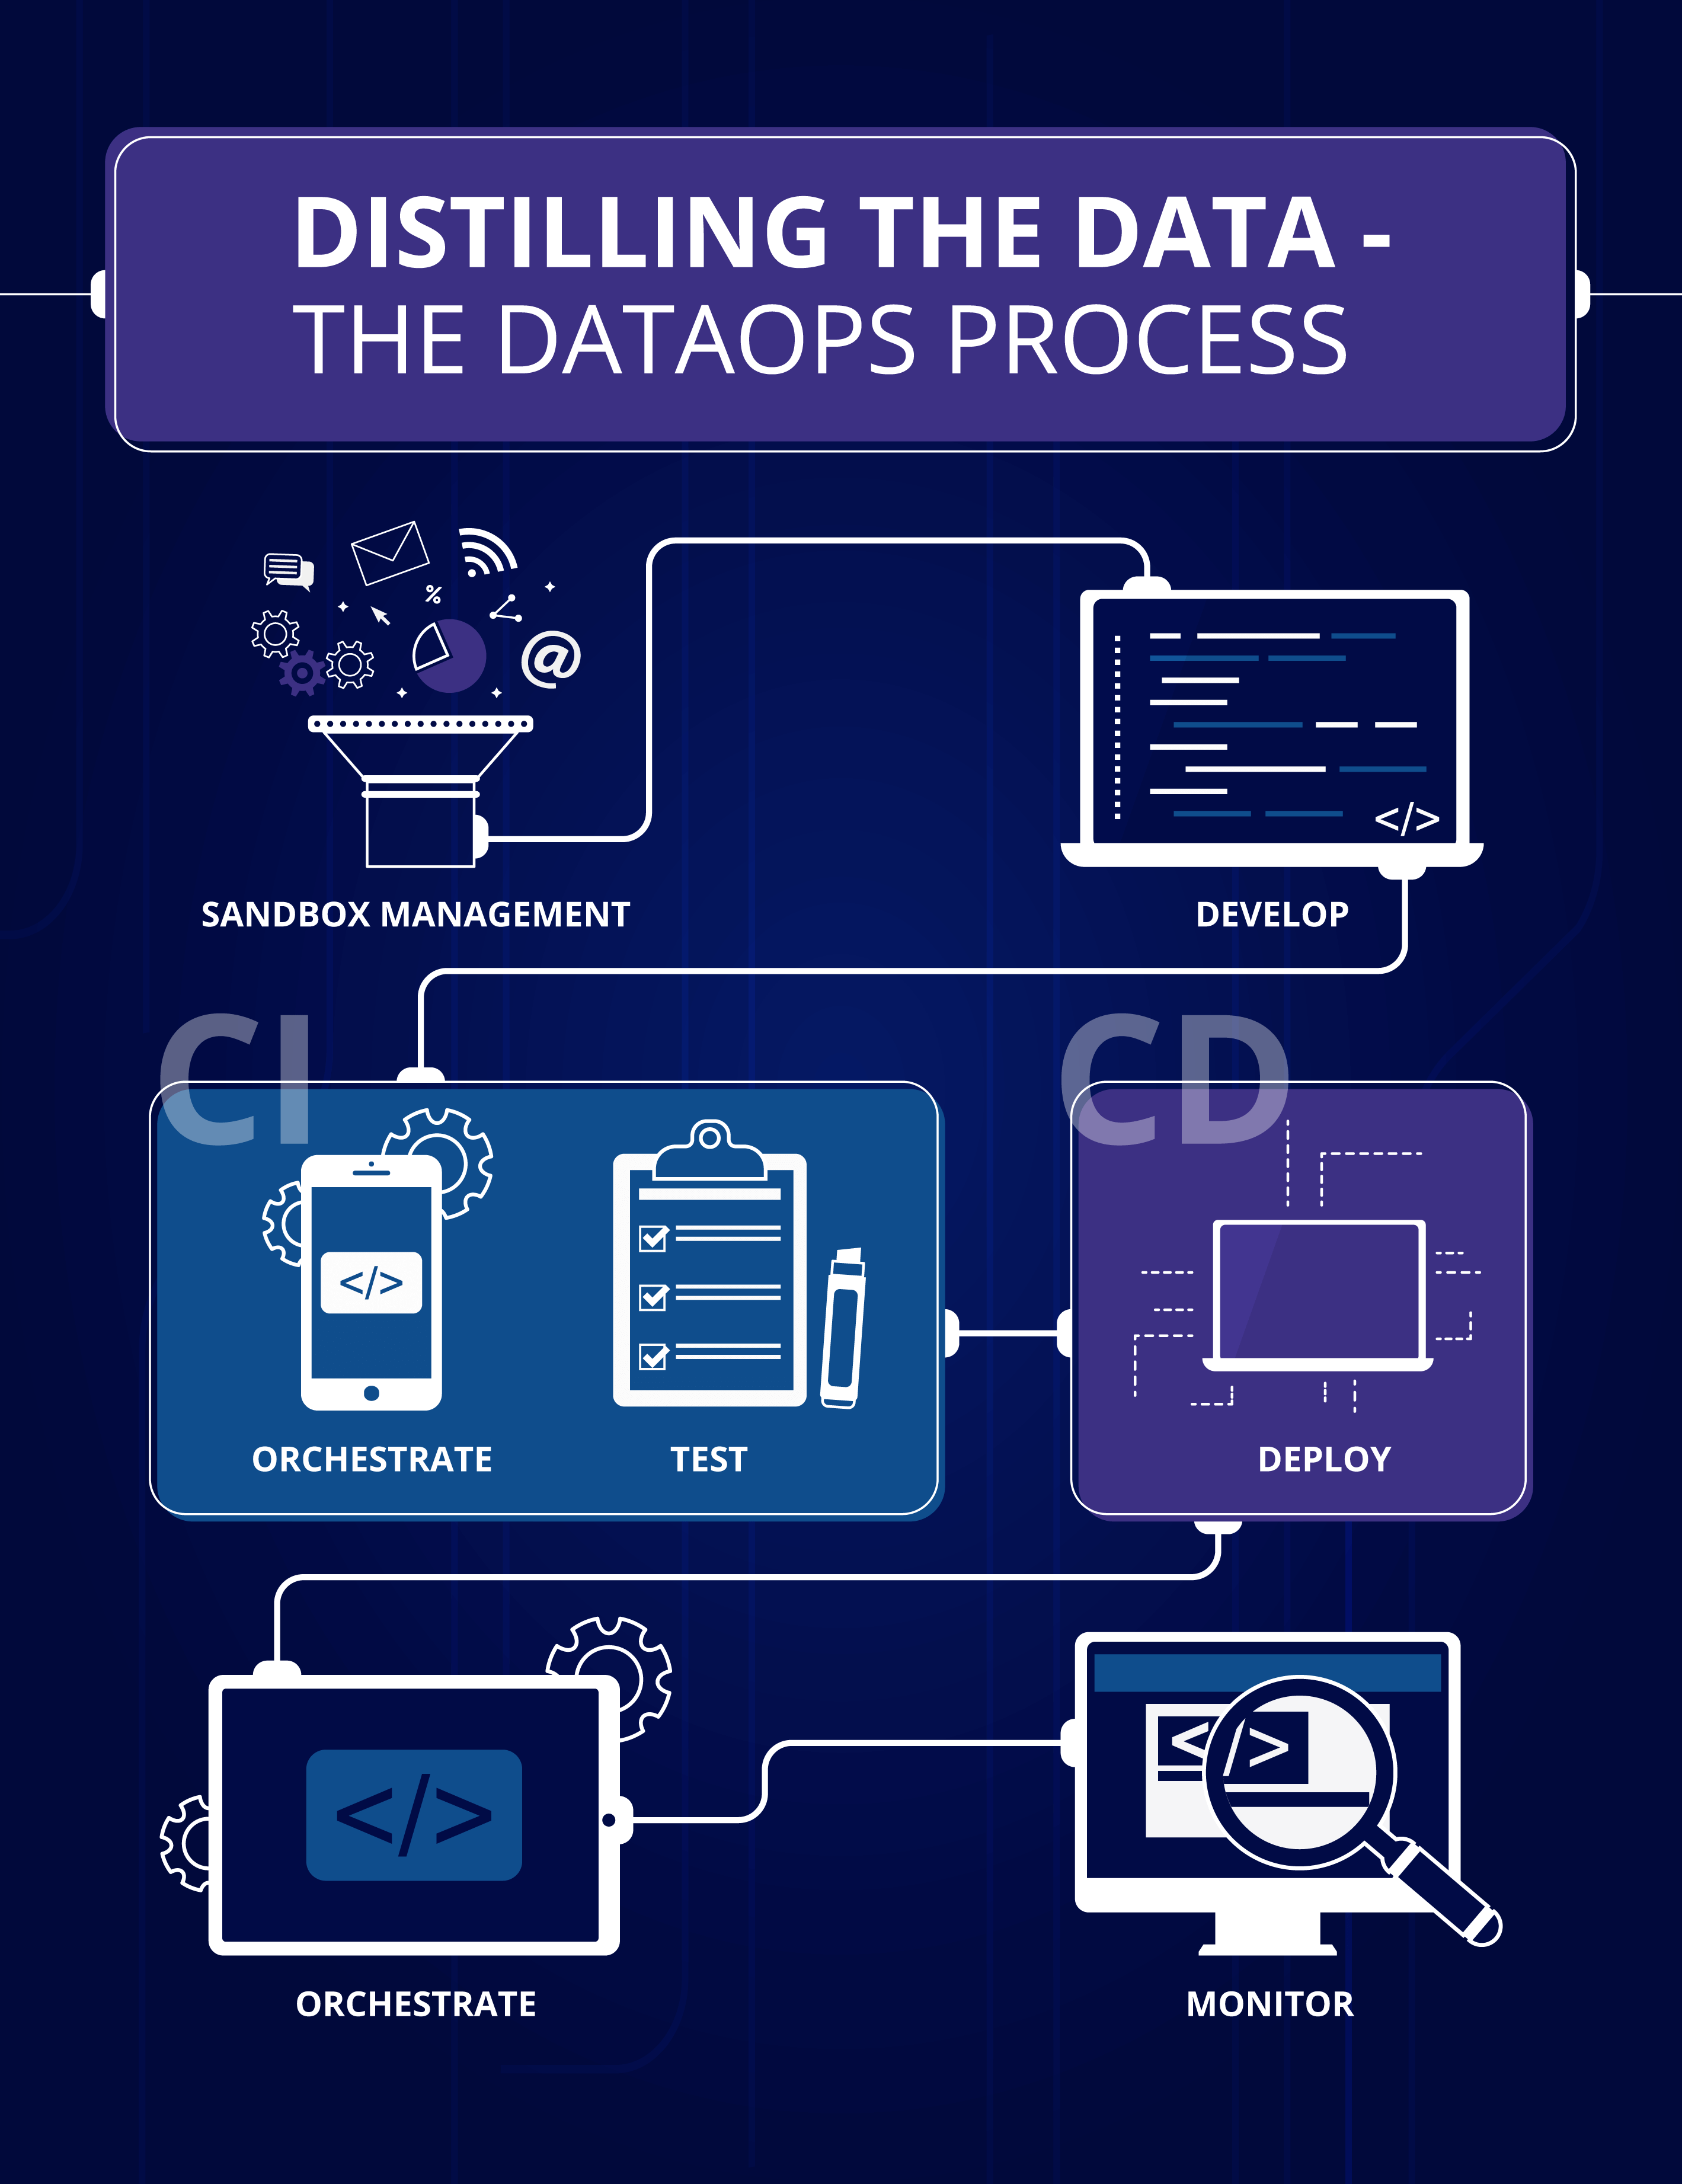
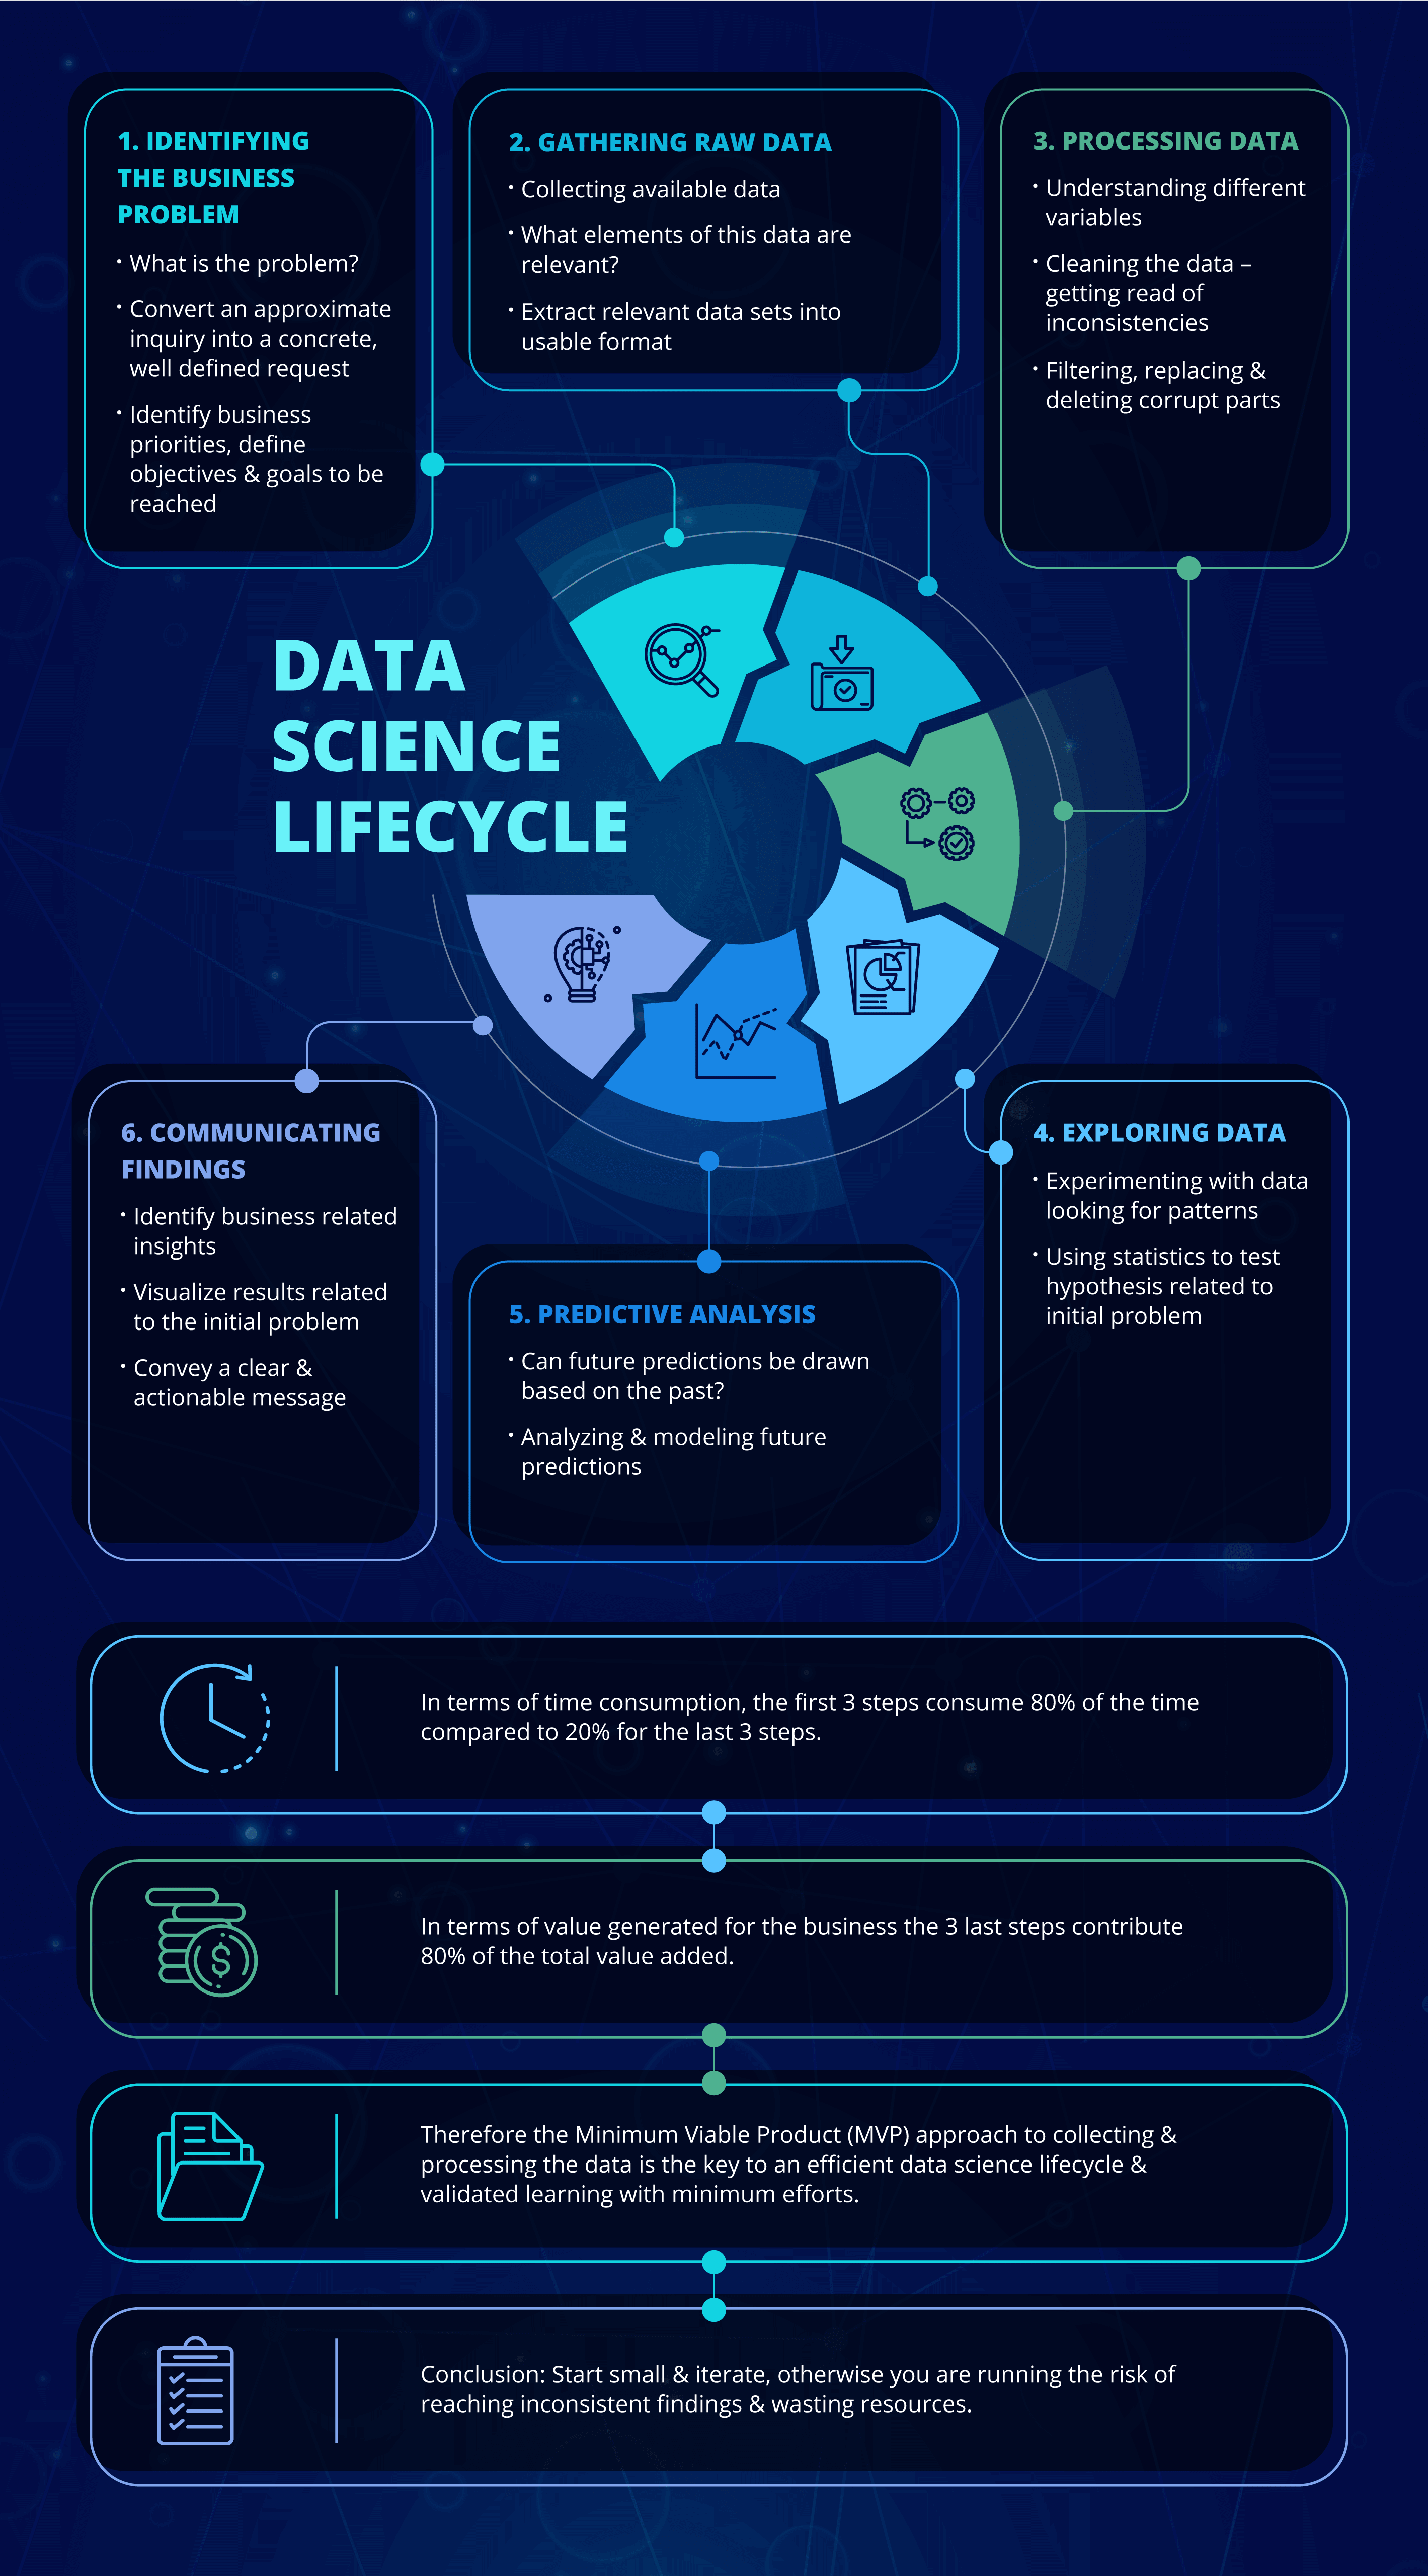
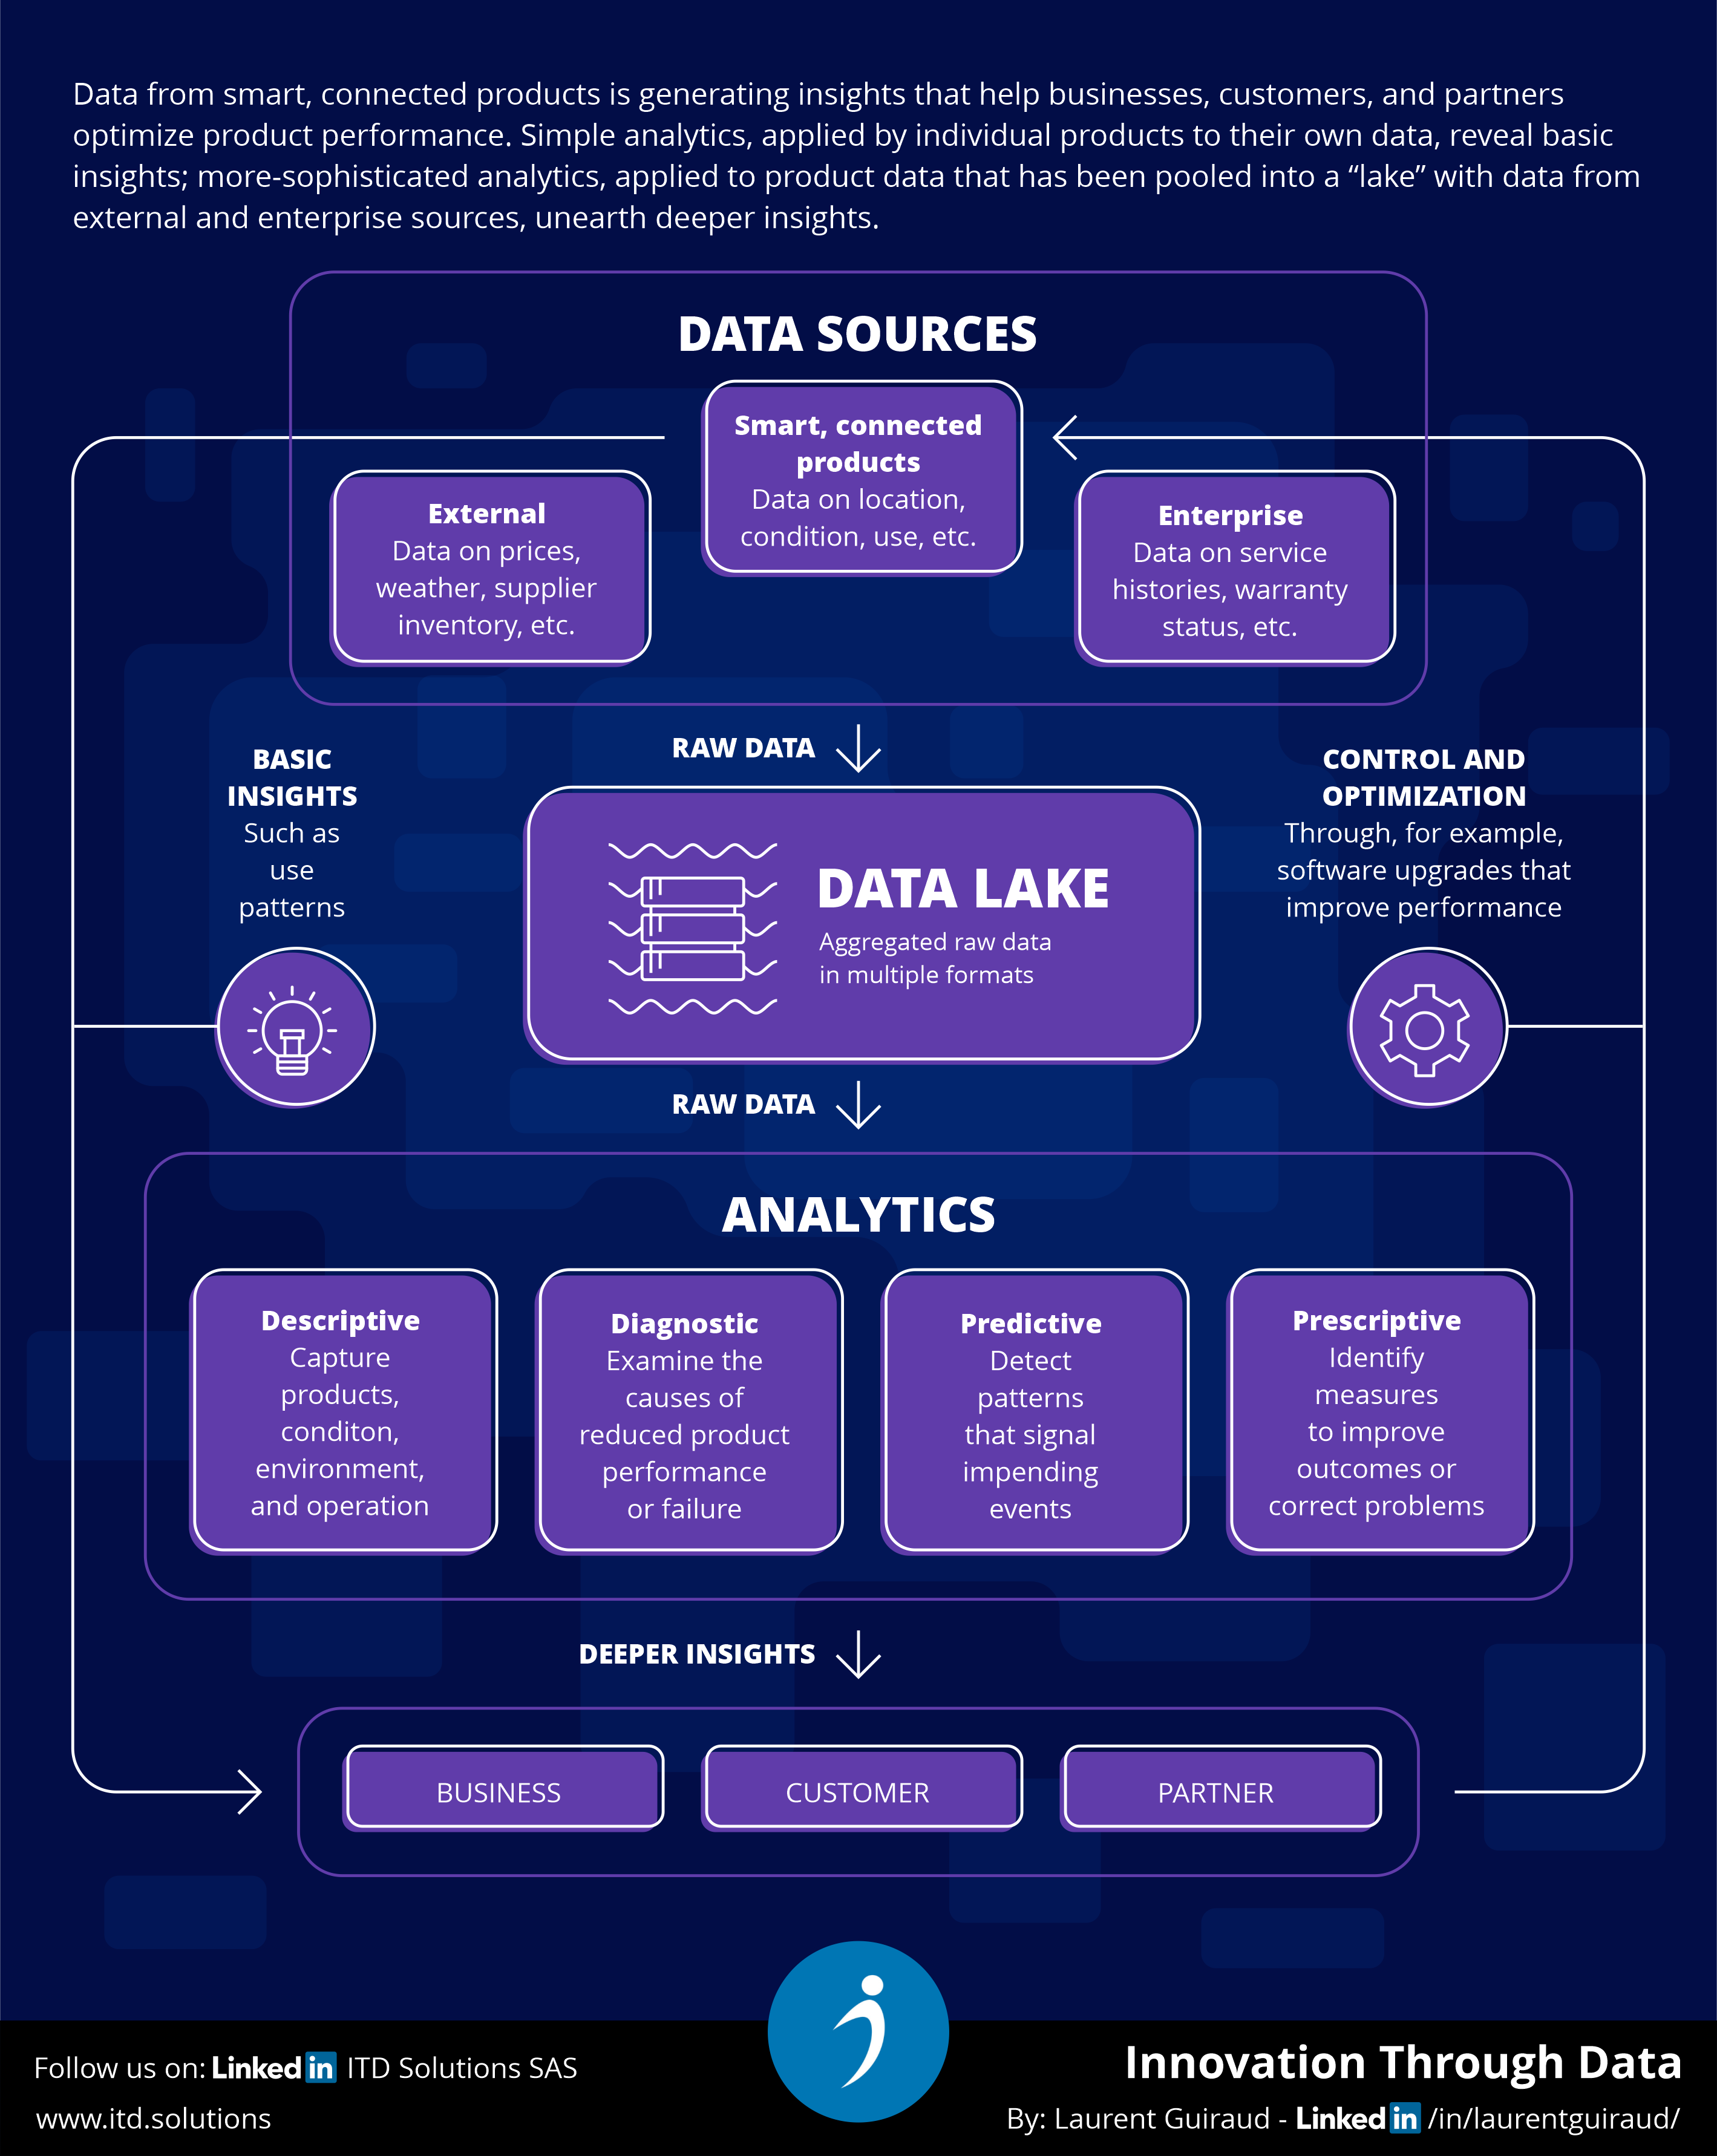
Design a series of infographics related to the data science topic, namely the data science lifecycle and data ops process. The primary goal of this project is to present the complex process flow in detail using various data visualization tools to make the topic interesting and clear for viewers.
We went with the flowchart infographic type and created a smart layout to organize the information most effectively. The dark background, in combination with the two bright accent colors blue and purple, creates excellent contrast and makes the infographics look appealing and eye-catching. At the same time, white lineart icons keep the design clean and minimalistic.
Category- Marketing Visuals
- Infographic
- Flowcharts
- One-pager
- Data
- Outline/Line Art