CPD Standards Infographic

Customer goal
The solution
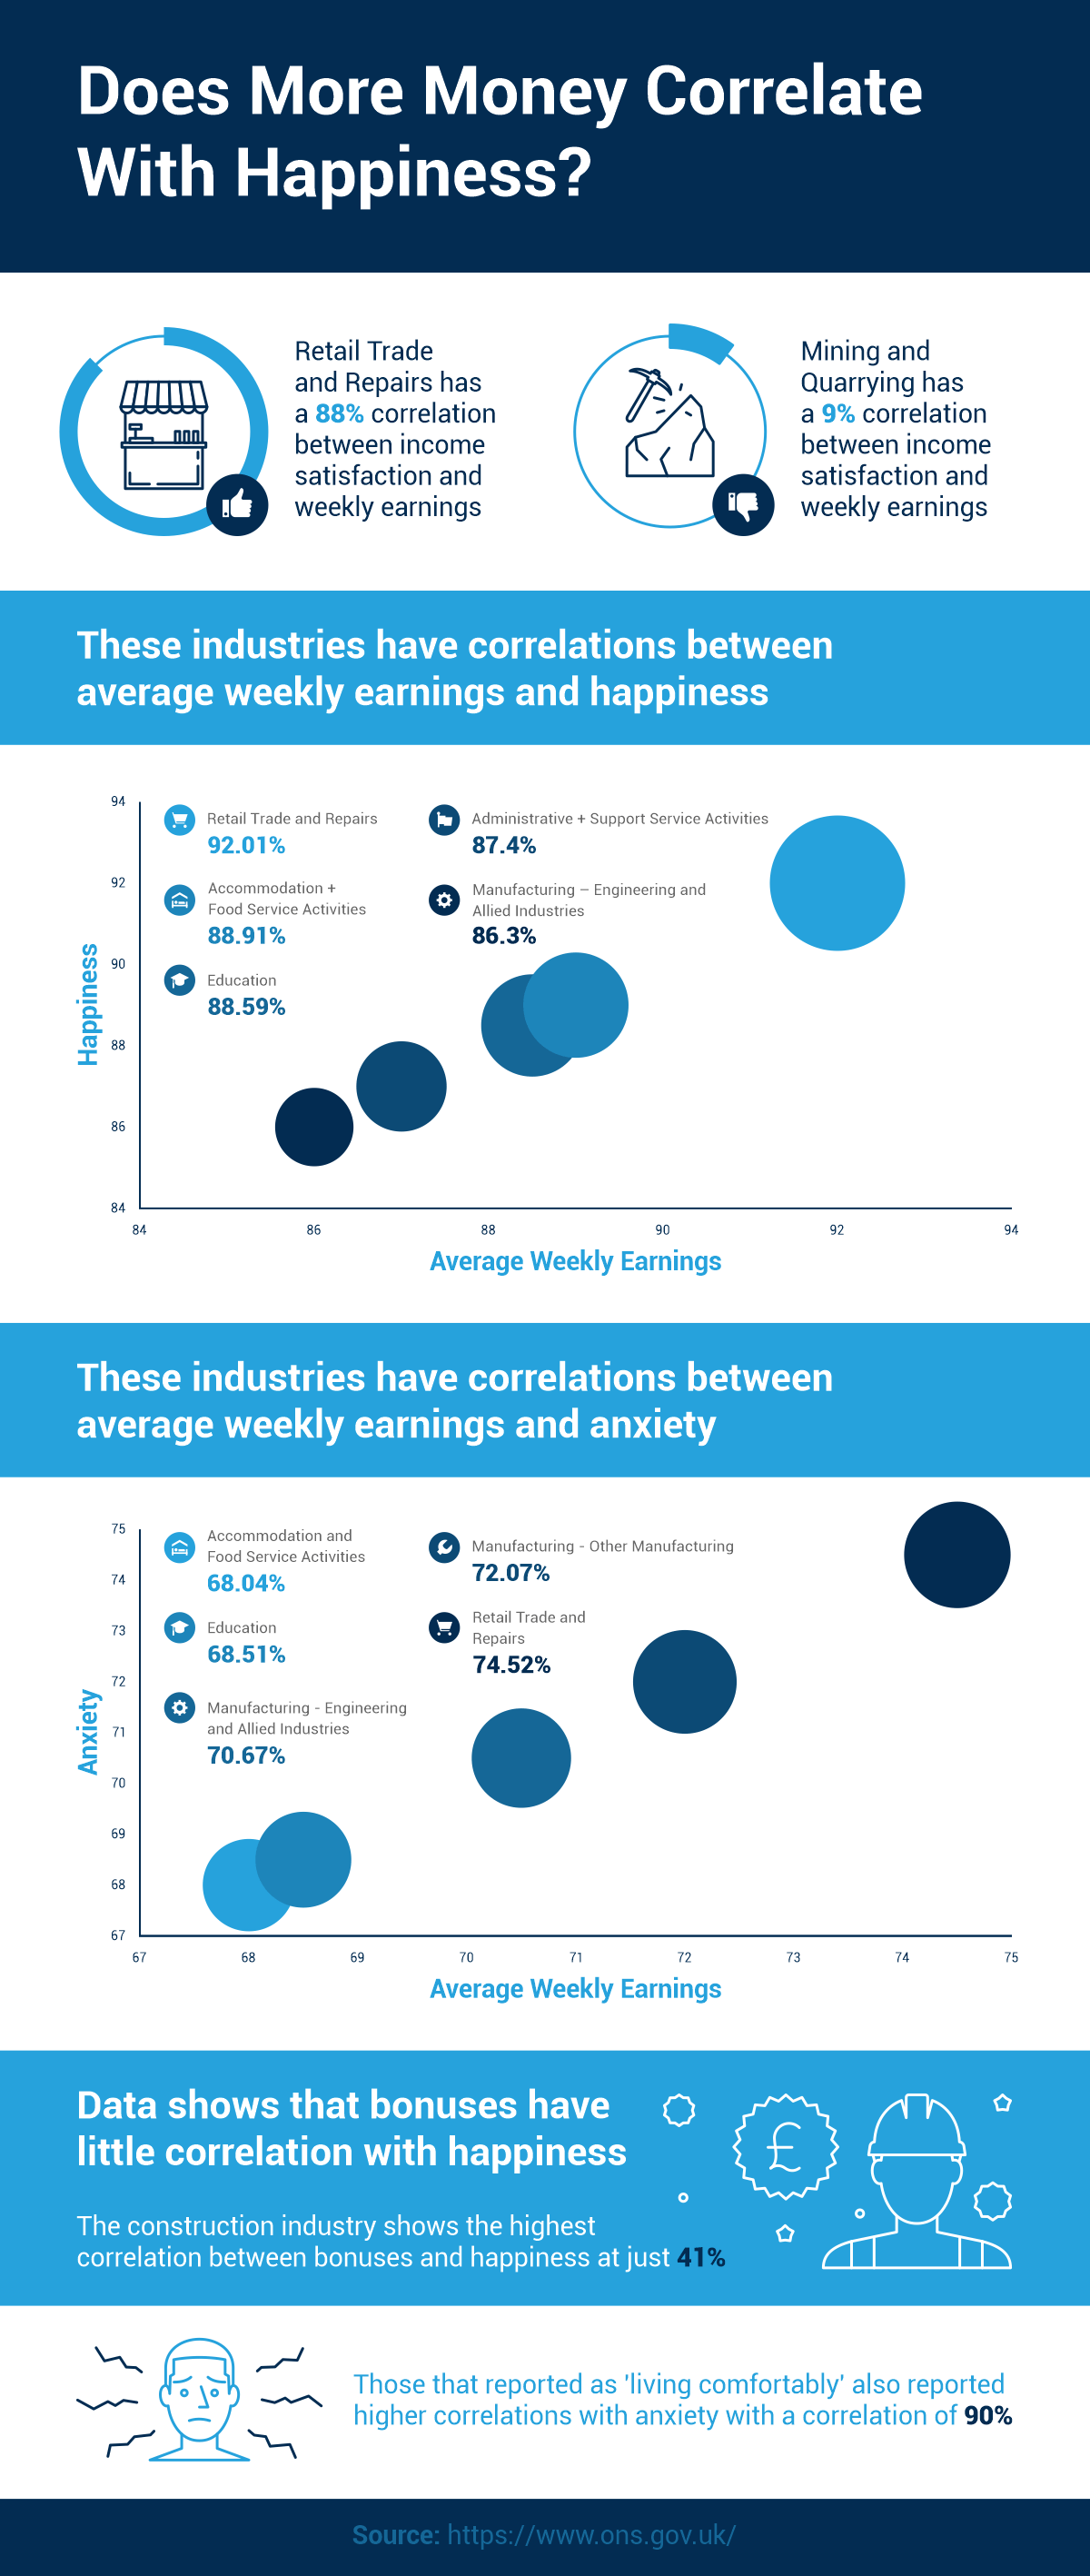
To create an infographic for CPD standards that shows the correlation between average earnings and happiness/anxiety.
Once again, we’ve worked with statistical data and we were looking for an interesting way to present it.
We’ve chosen the style Bubble Graph for charts and went with creating graphics in colors that match the client website’s ones. As there is not much verbal content, we’ve concentrated on recreating each statistical point with a simple flat style icon to enhance data as much as possible, and with the help of different shades of blue, we’ve represented the correlation from the best to worst.
- Infographics
- Statistical
- Financial Services
- Outline


