Cannabusiness Infographic
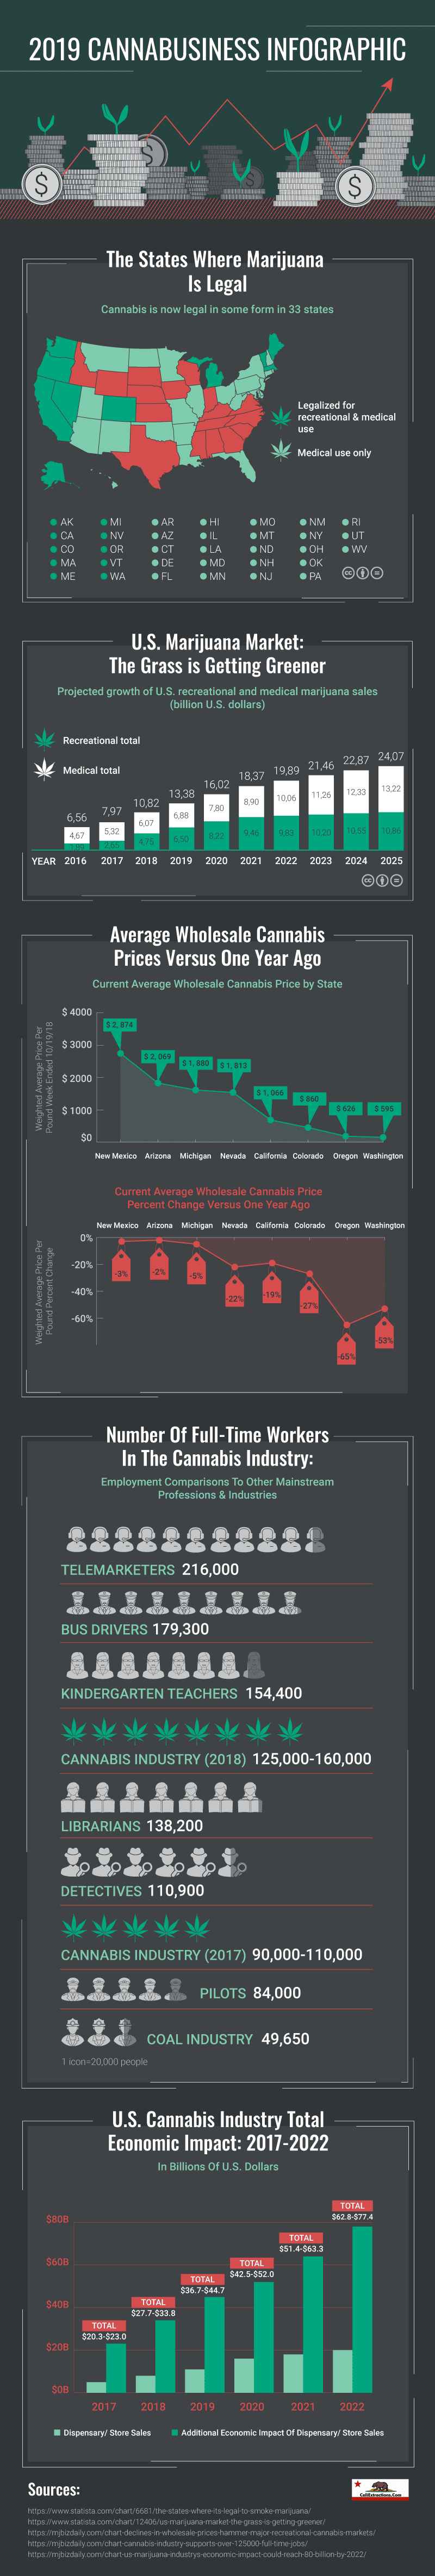
Create a mixed-chart infographic about the cannabis business in the United States of America. The primary goal is to present statistical data on the impact of legalizing medical and/or recreational cannabis usage in a range of states.
Since we needed to communicate a lot of statistics, facts, and figures to the readers, a mixed chart type seems a perfect fit for this project, as it incorporates various graph formats, starting from an ordinary graph and ending with maps. With the objective to complement the client’s corporate branding, we went with the 4-color palette: white, gray, and red brand colors were chosen as the basic ones; green was used to make accents. At the end, we managed to communicate a great deal of data simply and engagingly.
Category- Marketing Visuals
- Infographic
- Statistical
- Business & Consulting
- Flat